

There are several qualitative and quantitative methods for valuing a company. The appropriate quantitative method to use depends on the company’s stage of development, industry, the information available and the investor’s risk appetite. Here are my preferred useful methods which every investor should have up their arsenal:
P/E, PEG, P/B
The P/E ratio is obvious to most investors as it is the most commonly used metric. However most investors fail to understand the company’s background and don’t apply it correctly. Most consumer stocks will have a vastly higher P/E than most steel producers. Solar and wind energy companies will have a higher P/E than oil and gas companies. If you don’t understand this, I suggest carefully rereading the qualitative points described above. PEG is a modification of the P/E ratio as it incorporates earnings growth rate into valuation. P/B is useful for valuing manufacturing and financial companies.
Rule of Thumb:
Never pay more than 60-70 P/E.
For B2B companies 15-30 P/E is fair value.
PEG < 1.5 is a good time to buy the stock
For Banks & NBFCs, P/B < 3

Calculation:
P/E = Share Price / Earnings per share
PEG = P/E / Earnings growth rate
P/B = Share Price / {(Total Assets – Total Liabilities) / Outstanding number of shares}
Dividend Yield and FCF Yield
These 2 ratios are preferred by conservative investors as they seek tangible value with risk minimization. Such investors want their portfolio companies to share their excess profits by giving out dividends and reward the minority shareholders. It can add to their individual incomes. Free cash flows are a sign of business model maturity, execution capability and margin of safety.
Rule of Thumb:
Most companies will have a dividend yield of 0-3%. If a company is offering higher yields, then you need to study it carefully and determine if there is any problem with growth or lack of capital allocation opportunities.
FCF Yield > 5%
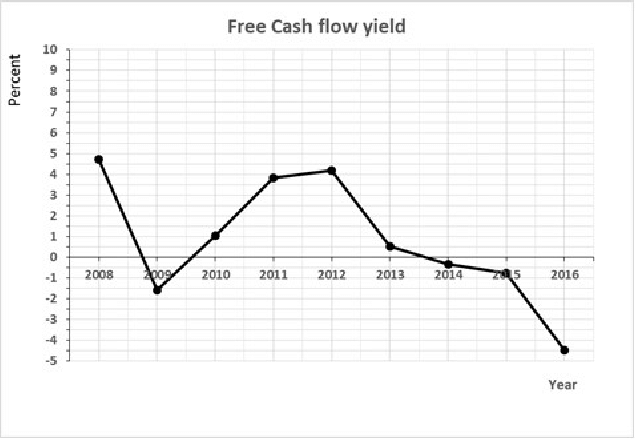
Calculation:
Dividend Yield = Dividend per share / Share Price
FCF Yield = Free Cash Flow / Market Cap
Reverse DCF
Reverse discounted cash flow (DCF) is a method for estimating the current value of a company based on its future cash flows. It is the opposite of a DCF analysis which estimates the future value of a company based on its current and expected future cash flows. It’s a good way to understand expectations embedded in the current stock price and calculations require lesser assumptions than a DCF. A Reverse DCF will tell you if the exact % growth expectation that is implied in the price. Then you can study historical growth rates and the current situation to determine if at a certain implied growth rate, is the company overvalued, undervalued or fairly valued.
Rule of thumb:
Discounting rate should be 12% for small caps and 8-9% for large caps
It is very sensitive to assumptions. Best to be conservative as historical growth rates are no guarantee of the future.
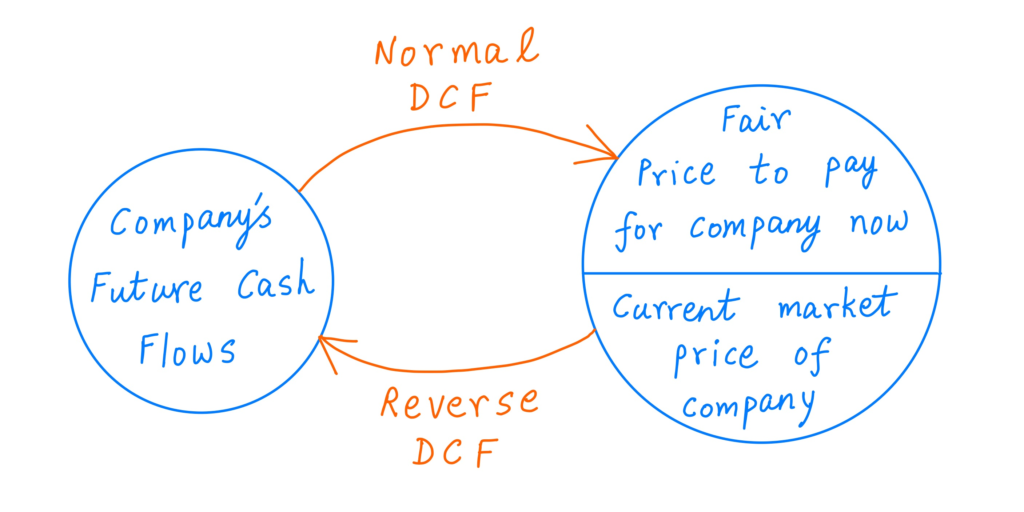
Calculation:
You can use websites like Tijorifinance.com for reverse DCF of any stock.
Peer Analysis
Within an industry, it helps to compare peers on profitability, sales growth, margin consistency and expansion to determine if the deviation in multiples is justified or not. These calculations also need to be adjusted for size as some industries where consolidation has happened or in progress, big will get bigger at the expense of smaller players. Thus, a higher multiple could be justified.
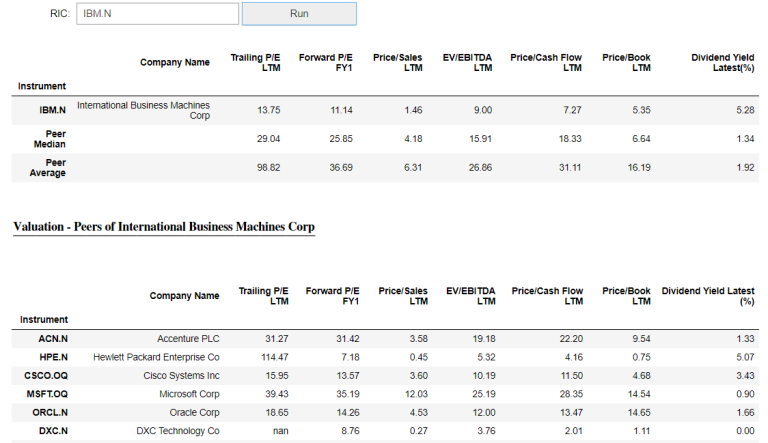
Rule of thumb:
If the leader is priced at twice or thrice of its smaller peer, then you need to deep dive and find out if such valuations are justified. If future growth rates are going to be similar or less than the smaller peer, then you need to question why the higher price for the leader? Paying a high price upfront could lead to lower returns going forward so be careful.
Price to Sales and Price to Cashflows
P/S is a useful metric for 2 kinds of firms: cyclicals and loss making tech companies. This is perhaps the easiest way to value loss making tech companies who are selling hope, optimism about a bright future and a promise of huge cashflows at some uncertain point in time. Most investors should shun complex stuff like customer acquisition costs and customer lifetime value as they are prone to exaggeration and wild assumptions. They should focus on P/S to evaluate when the sentiment is bullish or bearish. Similarly, using this for cyclicals can tell us when they are in oversold or overbought levels and help us with entry/exit. Price to cashflows is another good metric for valuation. However, sometimes negative cash flows due to aggressive capex can distort the actual figure so one should be careful.
Rule of Thumb:
For futuristic tech companies with little or no profits, acceptable P/S is 10-15.
Sell cyclicals when P/S is at 5 year high because unlike tech companies their profitability is not structural.
Price to Cashflows is considered good in the range 10-15.

Calculation:
P/S = Market Cap / Sales
Price to Cashflows = Market Cap / CFO
SOTP
Certain companies like Info Edge have multiple independent separate verticals and financial investments in different companies. To value such companies, we should perform a Sum Of The Part (SOTP) analysis where each component is valued on its own terms and then added together to determine the aggregate valuation for the entire entity. This is much better than other complicated unnecessary methods.
Rule of Thumb:
Markets tend to have a holding company discount. This means that companies with a lot of moving parts are often valued less than what they would get if each individual part is spun off.
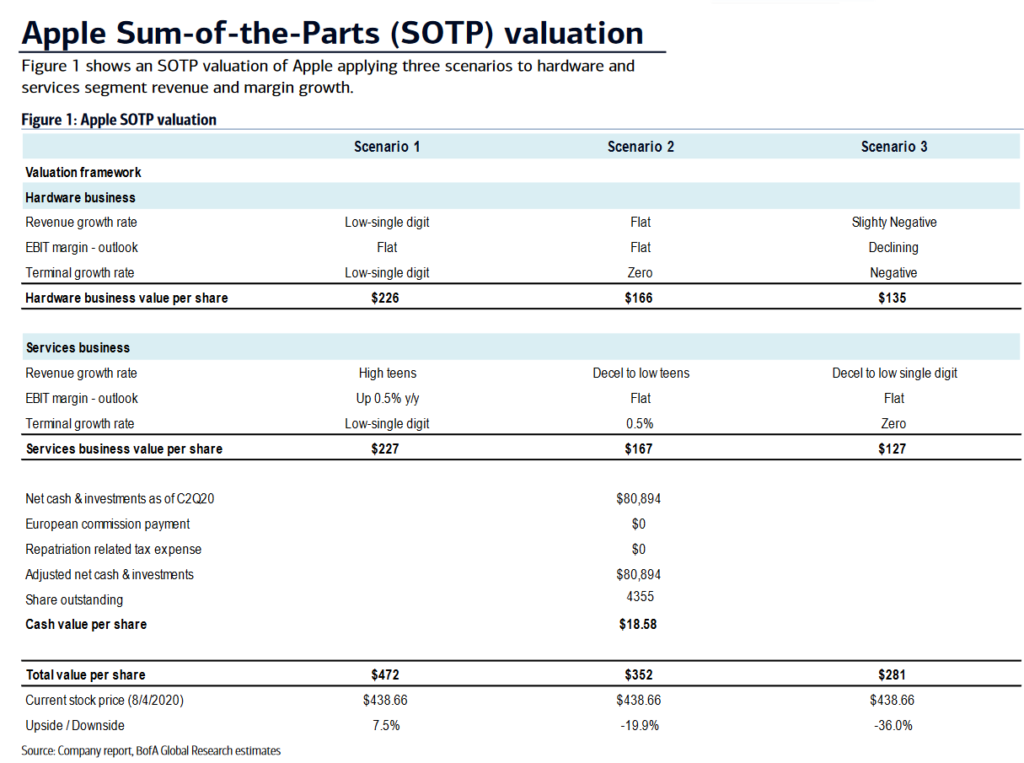
Calculation:
I will explain this later in detail in a separate blog post.
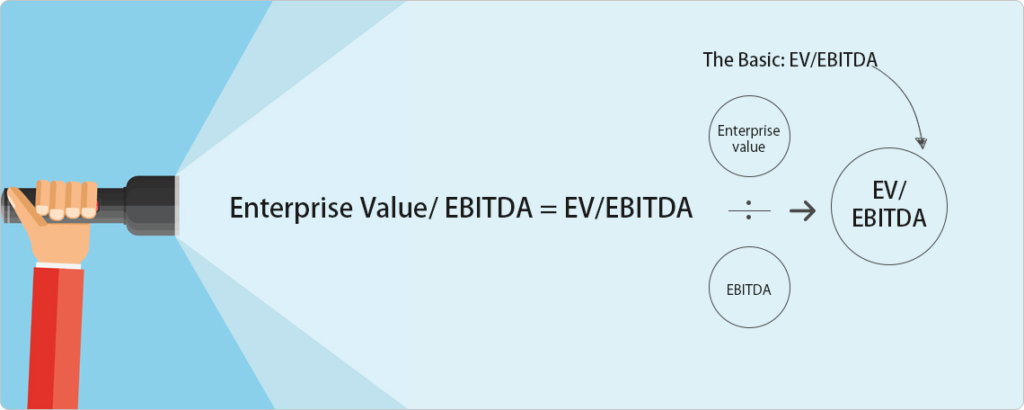
EV/EBITDA
This method is an institutional favourite and is often used in M&A. It ignores the impact of taxation and compares a company’s Enterprise Value (EV) to its Earnings before Interest Taxes Depreciation and Amortization. Like the other methods described above, fast growing industries get a higher multiple and slow growing ones deserve a lower multiple. This method can also be used to compare across industries.
Rule of Thumb:
Ideal for mid to large companies.
Calculation:
EV/EBITDA = (Market Cap + Debt – Cash) / EBITDA
Scenarios
It’s always useful to estimate potential returns in a bear, base and bull case scenarios. This can help us in position sizing and evaluating whether the stock deserves our attention or not. We can set an internal benchmark about minimum expected return and then decide if the scenarios match that or not.
Rule of Thumb:
Should be done for all companies that we are interested in.

Calculation:
Assume 3 different sales growth rate from worst to average to good for the 3 scenarios. Accordingly calculate net profit and assign a multiple to determine final value in 3-5 years’ time. You should also play around and assume margin expansion/compression, multiple rerating/derating, to check the likely impact on your stock. This will help you understand the full range of possible outcomes.
While there are other methods to do valuation, the above are in my opinion the most useful ones which will take you a long way in your investing journey. Remember, valuation is not an exact science, neither is it completely subjective like art. It is somewhere in between having the qualities of both. So what we are essentially looking for is to come up with an approximate figure which includes our margin of safety. Often it’s helpful to combine multiple methods to take a well-informed decision. Each investor has their own combination for valuation you can read more about mine here.
Leave a Reply