
It has been rightly said that accounting is the language of business. But you don’t need to be an accountant to be a good investor. You just need to understand accounts to calculate a few ratios, watch out for patterns and red flags to determine if it’s a risky investment or not. This blog aims to demystify some important ratios and present some red flags. The goal is to prevent investors from taking the management’s words for granted and make them capable of conducting an independent evaluation of the company’s financial records. These ratios are available on various stock screening websites (saving precious time), but it’s important for investors to understand what they represent to develop conviction to handle stock price volatility and determine future growth trajectory (screeners don’t make future predictions).
I’ll be explaining the following ratios: ROCE, ROE, ROIC, ROIIC, SSGR, Inventory turnover, Working Capital Days, Cash Conversion cycle, Debt to Equity and FCF.
Return on Capital Employed (ROCE) = Earnings before Interest and Taxes (EBIT) / Total Assets – Current Liabilities
We should invest in companies whose ROCE is significantly greater than their cost of capital. This enables them to generate large amounts of cash which can be used for various purposes like dividends, capex, acquisitions, buybacks, R&D etc. In India, the cost of capital for most companies is 10-12%. When the ROCE is less than the cost of capital, then it signifies that the firm is losing money and will eventually cease to exist when the source of funds dries up.

Return on Equity (ROE) = Net Profit Margin x Asset Turnover x Financial Leverage = (Net Profit / Sales) x (Sales / Total Assets) x (Total Assets / Shareholder’s Equity) = Net Profit / Shareholder’s Equity
The above formula has been broken down and shown as a sum of its parts. It can be used to identify the drivers of a company’s performance. A high profit margin means the company has pricing power and can charge a premium to its customers. Conversely a low profit margin indicates that the business is commoditized in nature and the company is a price taker. Generally, asset turnover is higher in commoditized products which sell in high volumes and lower in specialty products for whom the volumes are limited. Financial leverage can tell us whether the company is using debt to fuel its growth. If the company is over leveraged, then it is a red flag for investors, and they should proceed with caution. This is especially relevant for financial companies. Great banking & NBFC franchises have ROEs in excess of 14%.
Note: Shareholder’s Equity = Total Assets – Total Liabilities
Return on Invested Capital (ROIC) = NOPAT / Invested Capital
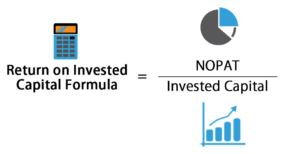
This is a good ratio to understand the company’s capital efficiency. However, it should not be confused with its more famous cousin – ROCE which is used for comparison with competitors and across industries. The main reason why ROIC can’t be universally applied and compared is because taxation across companies can be different due to various factors.
Note: Invested Capital = Net Fixed Assets + Net Working Capital
Return on Incremental Invested Capital (ROIIC) = {(NOPAT of Year N) – (NOPAT Of Year N-4)} / {(Invested Capital of Year N) – (Invested Capital of Year N-4)}
According to me, this is the holy grail of accounting ratios, and an absolute must to evaluate companies. It is relatively less known and talked about. It simply tells us how well a company can deploy incremental capital. It is advisable to check 10, 5 and 3 Year ROIIC numbers to check if capital is increasingly deployed at lower or higher returns. This ratio is more useful than ROCE because ROCE is concerned with total capital deployed and past success does not guarantee future returns. It is essential for companies to deploy incremental capital at rates superior or equal to the past.
Self-Sustainable Growth Rate (SSSG) = Net fixed asset turnover x Net Profit Margin x (1-DPR) – Dep
It is a measure of a company’s organic growth rate without usage of debt or equity dilution. This ratio has helped me understand and evaluate some fast-growing profitable companies that need capital infusion from time to time. As investors, we need to understand the implications of hyper growth on a company’s finances.
Note: (1-DPR) = Dividend paid as % of net profit after tax, Dep = Depreciation rate as a % of Net Fixed Assets
Inventory turnover = Cost of Goods sold / Average Inventory
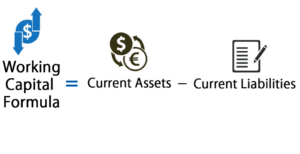
Working Capital Days = (Working Capital * 365) / Sales
Cash Conversion Cycle = Days Inventory Outstanding (DIO) + Days Sales Outstanding (DSO) – Days Payable Outstanding (DPO)
These 3 ratios need to be looked at together as they tell different parts of the same story. How quickly does a company sell its products, how much capital is required for this effort and how long is the actual cash cycle from paying suppliers, creating inventory, selling products, receiving customer payments? Very important ratios that every investor must consider when evaluating a company. Ideally, the company should have a high inventory turnover with negative working capital days and cash conversion cycle. However, it’s very rare to find all 3 features in good measure in an undervalued / fairly valued company.
Note: DIO = (Average Inventory / COGS) x 365
DSO = (Average Accounts Receivables / Sales) x 365
DPO = (Average Accounts Payable / COGS) x 365
Debt to Equity = Total Debt / Shareholder’s Equity
A very simple useful ratio that can tell us if the company is deep in debt or not. A number below 1 is considered healthy and beyond 1.5 is a possible red flag which warrants deeper analysis. Debt is not a bad thing when used productively. However, the trouble starts when a company takes on too much debt far beyond what it can handle and then it starts affecting its operations. Debt can be addictive, so the wise management uses it judiciously.
Free Cash Flow (FCF) = Cash Flow from Operations – Maintenance Capex
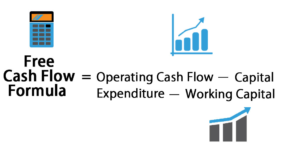
There are 2 major differences between good and great companies: a) quantum of free cash flow generation and b) how the free cash flow is used. While the above formula seems straightforward, the tricky bit lies in estimating maintenance capex which is not necessarily outlined by all companies every year. A good proxy for this is depreciation & amortization expenses. A more comprehensive method to calculate maintenance capex has been shared by Bruce Greenwald in his book on Value Investing. As smart investors, we need to understand the company’s past record of FCF usage as well as future plans as they affect the company’s net worth. Also, low or no FCF isn’t necessarily bad if a company is heavily reinvesting into the business to achieve its long term goal.
A lot of investors buy great companies whose business model is so strong that it’s reflected in the accounting ratios. However, the maximum amount of money has been made by those investors who invested early in an unknown, untested company which ultimately emerged as a champion. In this sense, solid accounting ratios are a lagging indicator of business potential because they talk about the past. Investors should definitely buy great companies, but these days great companies are rarely available at great prices. The skill lies in identifying emerging champions whose business is transforming and riding their growth. This obviously means that in most cases when you buy such a business, the ratios will be average/above average. Your conviction in the business potential will help you stand out from the crowd and go against the tide. Years late when the business produces great results, the ratios will reflect this and you will have made bucket loads of money. There is another tough skill an investor can master, buying undiscovered mini-champions at cheap/fair prices. But these opportunities are very rare like finding water in the desert.
Leave a Reply